How Work Load Analysis works?

Nirupa
Last Update hace 3 años
Welcome to Workfolio.,
Now it's easier to manage your employee's work-life balance. You can easily see who is over-employed and who is under-employed. With this report, you can divide and distribute tasks according to the employee's bandwidth.
This feature is available for the Pro plan users.
To view Workload analysis
Visit Reports->Work Load Analysis
And also you can view it on the Overview page.
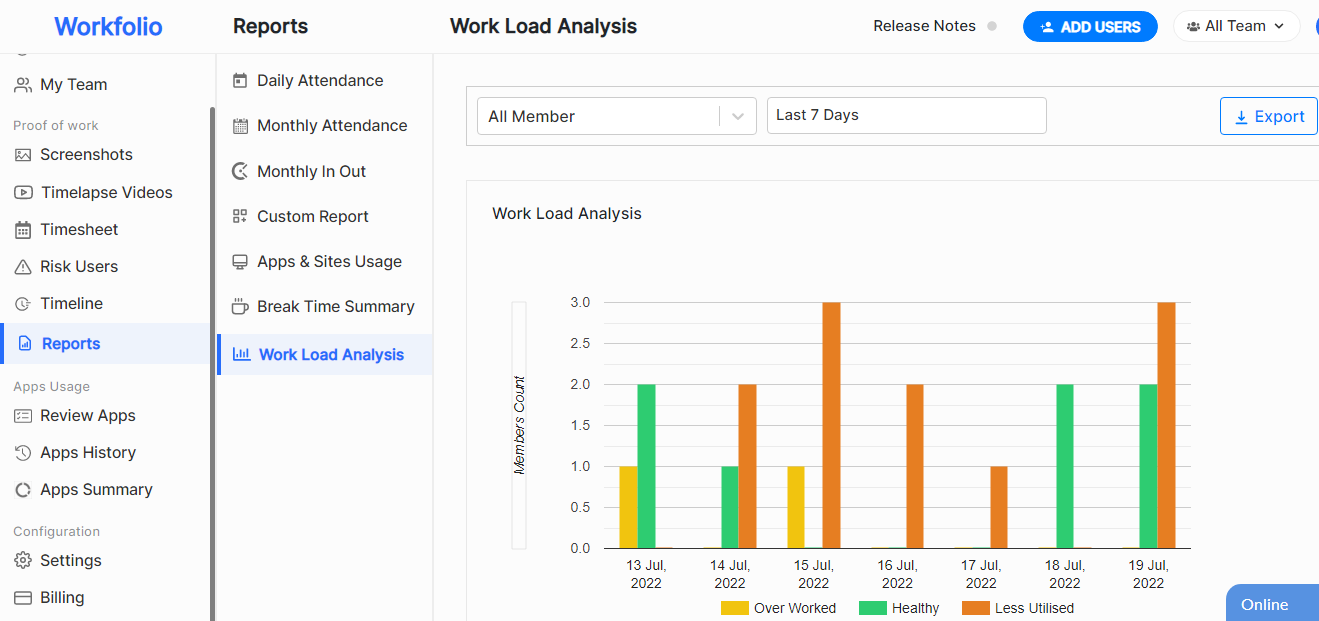
You can also view the data and export reports of a single member by applying the filter.
The bar graph has three indications, they are
The yellow bar appears when an employee works more than 1 hour of the expected work hours.
Healthy(green)
The green bar appears when an employee works between more than 1 hour of minimum productive work hours and more than 1 hour of expected work hours.
Less Utilised(Red)
The Red bar appears when an employee works below minimum productive work hours(i.e: min productive work hour + 1 hour).
Where does the bar graph get data?
The workload analysis bar graph works based on the information provided in Settings -> Track settings.
Here you can set
1. Work Time settings
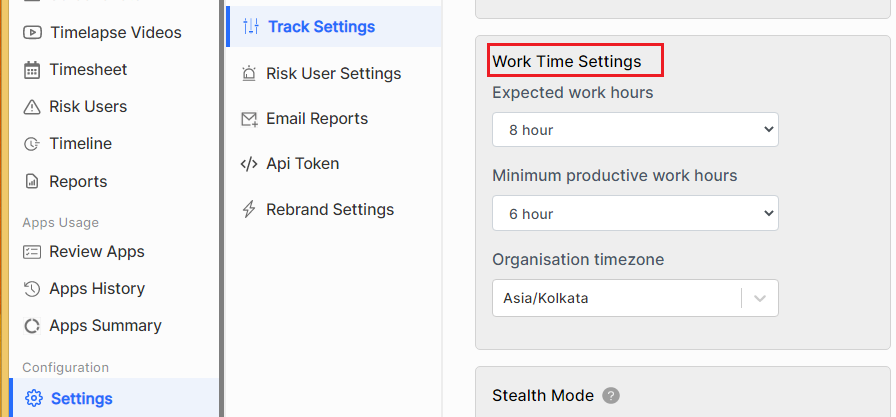
Finally, Save the track settings.
If you have any quires, feel free to contact support or send us a mail to [email protected]